
What it delivers
Put production data in context. See the whole plant more clearly.
PPI brings equipment layout, production data and operator expertise together to give teams a technical basis for decisions they can trace back to the evidence.
The workflow has three stages: establish the context, draw out findings and review them with subject-matter experts.
01 · Establish a verified context
Understand the system. Then analyse the data.
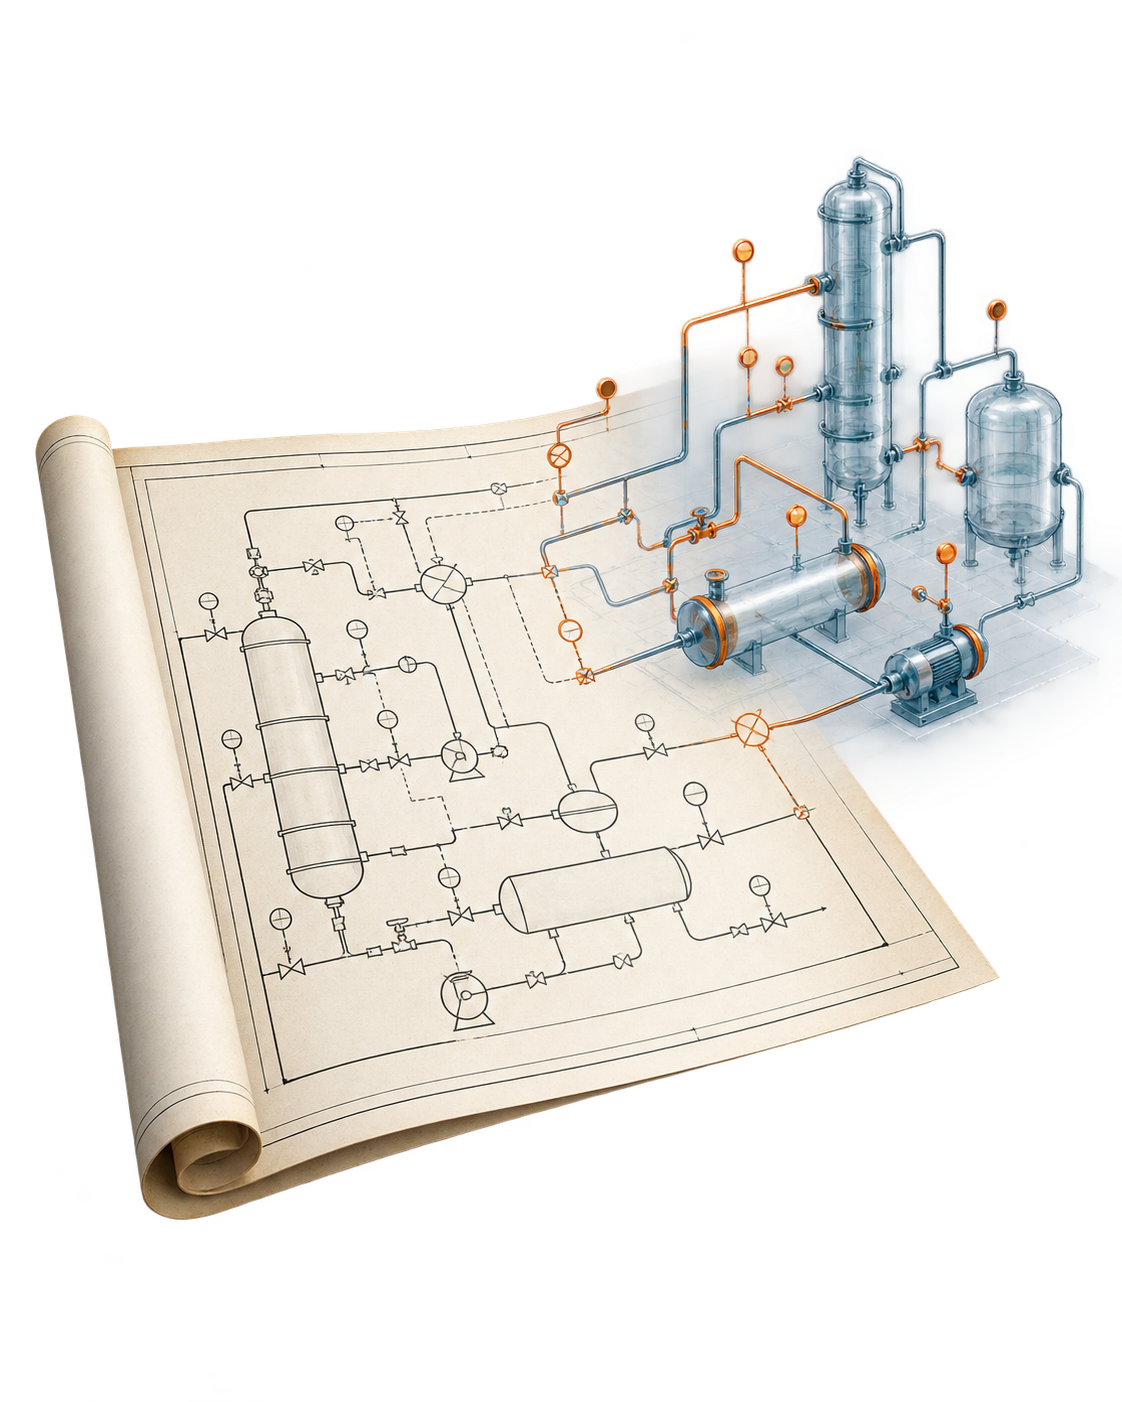
- Digital clone: Process diagrams, signals and data sources show how machines, process steps and measurement points relate to one another.
- Operator review: Operators review how the plant works, including its operating modes and limits. Only the approved version of the model is used for analysis.
- Data in context: Time series, operating states, events and system messages are mapped to the model. Data gaps and areas that cannot be assessed stay visible.
The result is not a pile of disconnected data; it is an analysis grounded in a reviewed model of the plant.
02 · Findings that can be checked
Technical findings you can check.
PPI turns the reviewed plant and data context into distinct findings, each of which can be examined on its own.
- Observation: What do the data actually show?
- Derivation: What effects can reasonably be inferred from those observations?
- Hypothesis: What mechanism might explain those effects?
- Cross-check: What would confirm the hypothesis, weaken it or leave the question open?
The evidence, credible alternative explanations and missing information remain visible on screen.
When the evidence is not enough, PPI says what is missing and what would need to be checked next rather than implying unwarranted certainty.
Each interpretation is linked to the approved model version, the time period and the data it used. This makes it possible to compare findings over time and see how they change.
Unresolved hypotheses turn into a practical checklist: what additional signal, comparison period or on-site check would help distinguish between the remaining explanations?
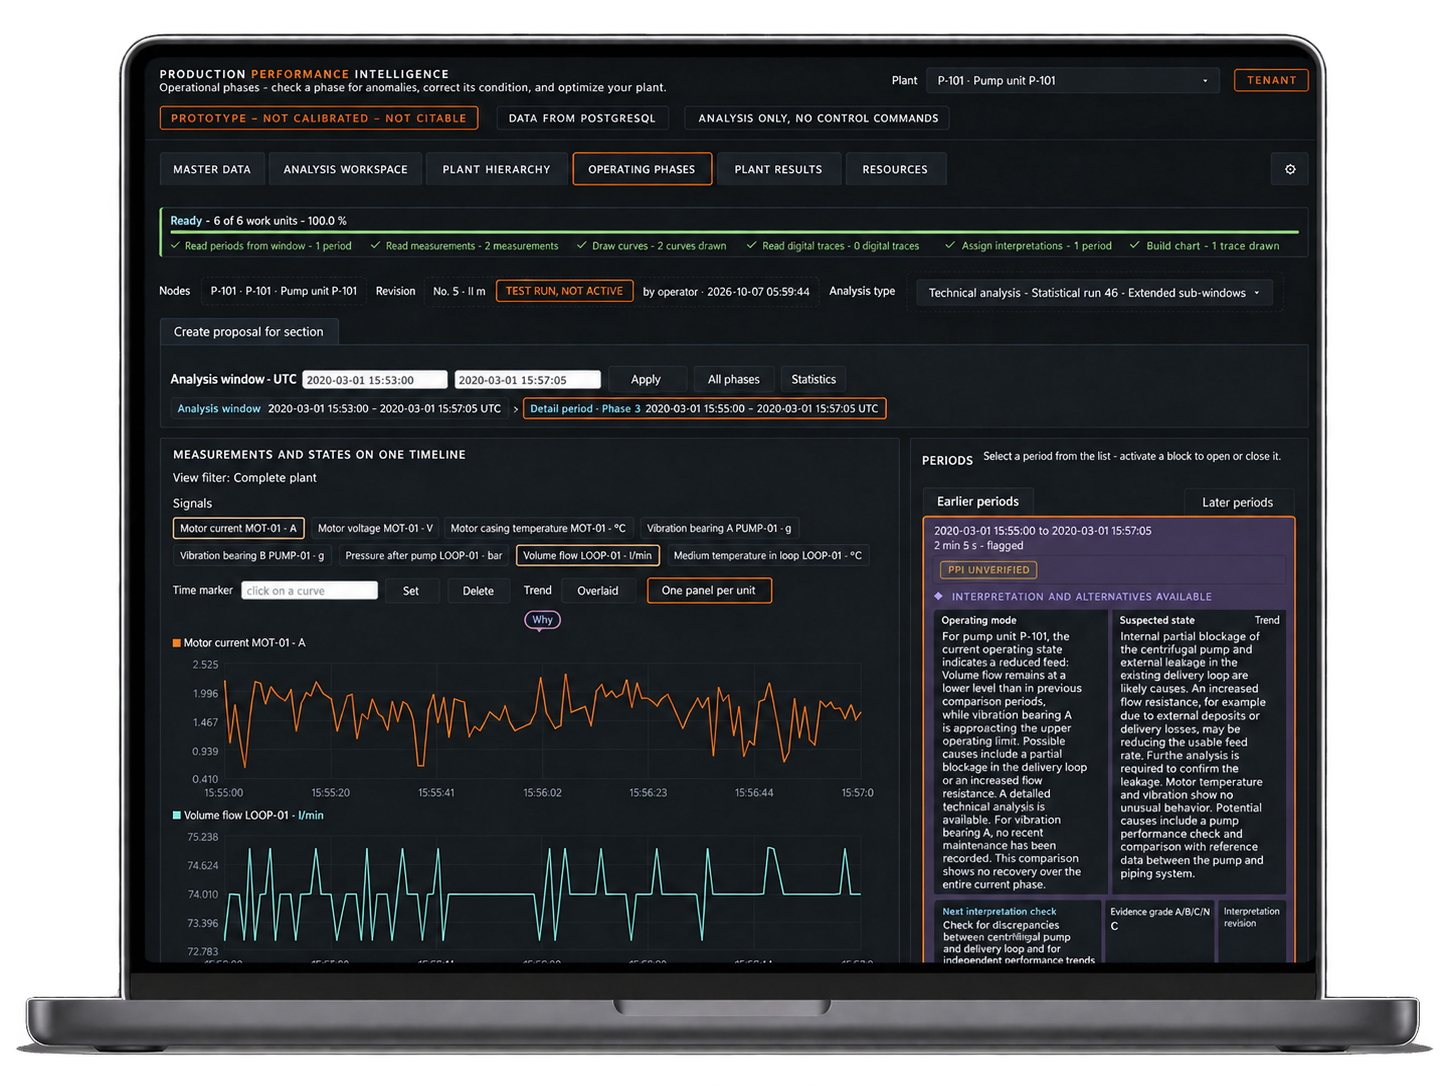
Hover over the screen to enlarge the details.
How strong is the evidence?
A, B, C and N rate the support for a finding within an interpretation. They are not probabilities or signs of later operator approval.
- A · strongly supported: several consistent sources of evidence, with no significant alternative explanation.
- B · mostly supported: the evidence favours the finding, but confirmation or an alternative explanation remains open.
- C · weak or contradictory: plausible, but not supported well enough by the evidence.
- N · not assessable: key data or evidence needed to distinguish between explanations is missing.
03 · Bringing it together
See the findings in the context of the whole plant.
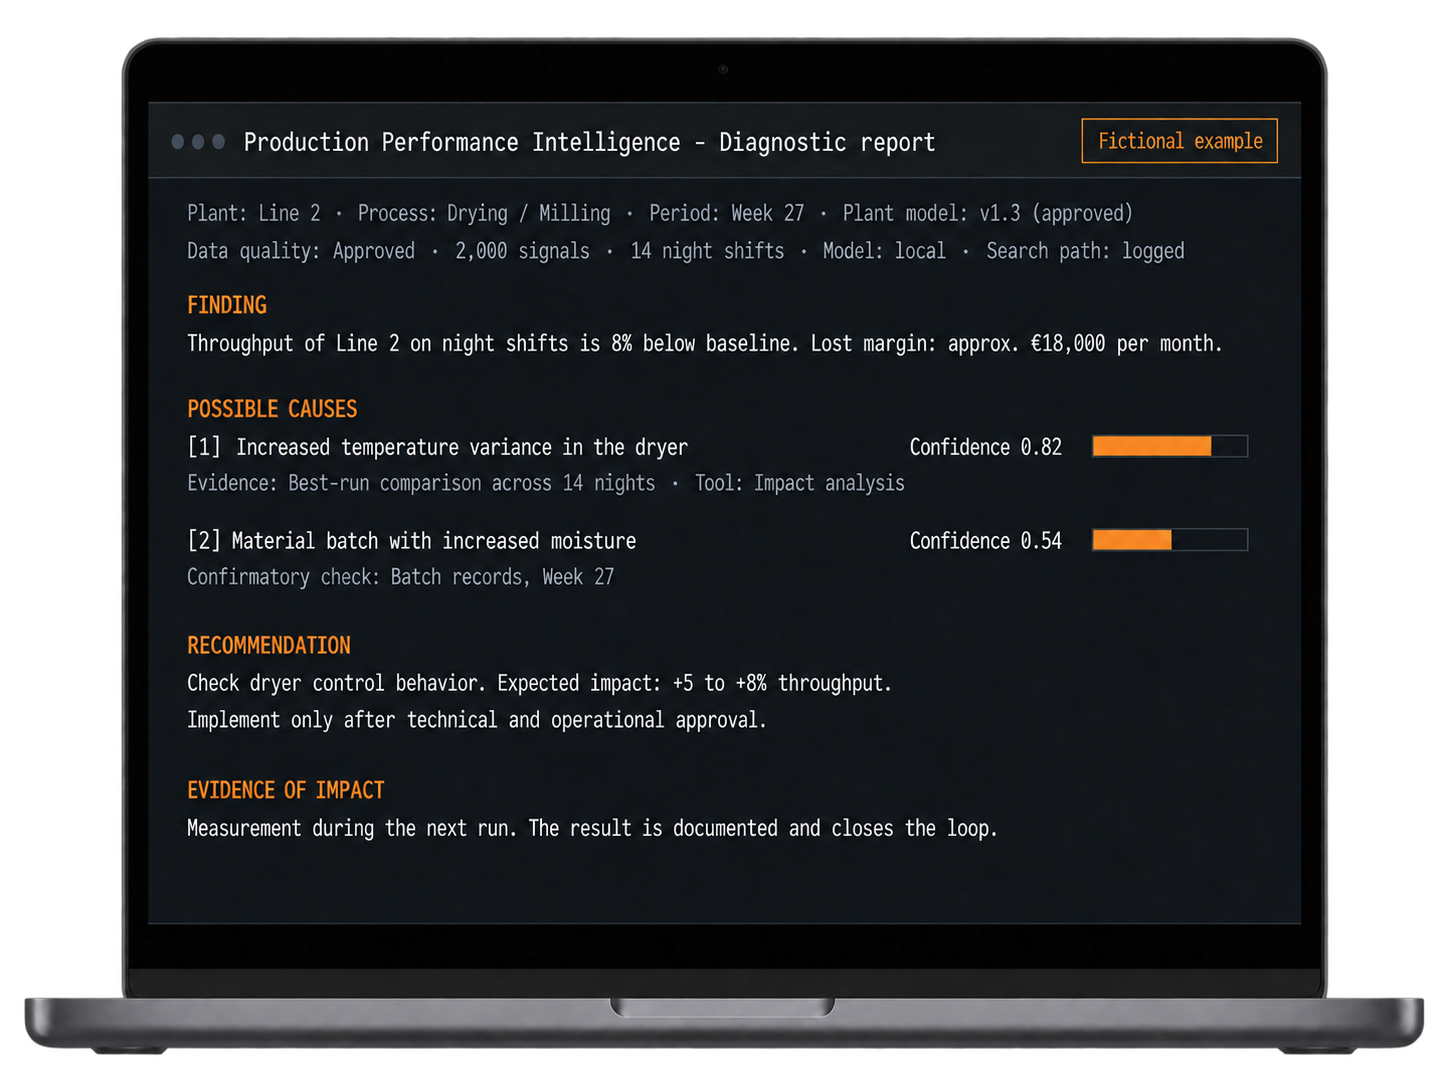
The results view brings operating states, technical findings, possible causal links and unresolved alternatives together in one traceable picture.
It separates what the data show from what they may explain, makes the limits clear and points to the next check or action most likely to improve understanding.
Operators confirm, reject or add context to the findings. Only then are possible actions prioritised. PPI does not issue automatic control commands.
After a measure has been approved and carried out, the same data framework is used to check whether the expected effects on throughput, quality, energy use, capacity or maintenance occurred.
Impact is checked, not assumed.
Contact
Start with a real production question.
Together, we define the part of the process, the data available and the decision PPI is meant to support.